

AI Demand Forecasting: How It Works, What It Costs, Where to Start
AI demand forecasting is the use of machine learning to predict future demand for a product or service by learning patterns across historical sales, inventory, pricing, promotional and external data, and it continuously corrects itself as new data arrives. Unlike traditional statistical models, it does not assume the future will repeat the past.
That distinction is why the category is moving so quickly. Gartner predicts that 70% of large organizations will adopt AI-based forecasting to predict future demand by 2030, while noting that adoption today remains limited. The barriers are unclear vision among planning leaders and persistent problems with data quality and accessibility.
This guide covers what AI demand forecasting is, how it differs from the statistical models most planning teams still run, how accuracy is actually measured, what implementation looks like step by step, what it costs, and where it falls short. If you are evaluating whether to move off spreadsheets and legacy planning tools, this is the whole picture.
Why Demand Forecasting Matters Across The Supply Chain
Demand forecasting is the analytical process of predicting future demand for a product or service over a defined period, using historical sales data, market trends, seasonality, promotional activity and external factors such as economic indicators or shifts in consumer behavior. Every downstream decision in the business inherits the quality of that forecast. Get it wrong and the error does not stay contained, it propagates into purchase orders, production schedules, labor plans and cash flow.
The cost of getting it wrong is measurable. IHL Group’s research found that the global retail industry loses $1.73 trillion annually to inventory distortion that combined cost of out-of-stocks and overstocks. Both are forecasting failures wearing different clothes.
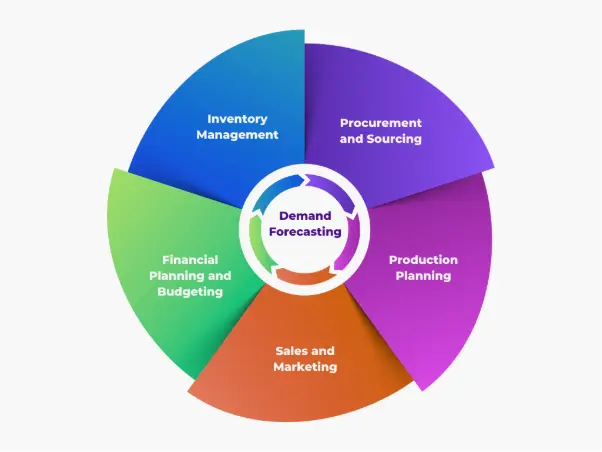
Accurate forecasting drives decisions across five functions:
- Inventory management. Forecasts set the right stock position — enough to protect service levels, not so much that working capital sits idle in a warehouse depreciating.
- Procurement and sourcing. Forward visibility lets buyers commit earlier, negotiate better terms, and stop paying for expedited freight to cover gaps that were predictable weeks ago.
- Production planning. Manufacturers use forecasts to decide what to build, in what volume, and in what sequence — avoiding both idle lines and bottlenecks.
- Sales and marketing. Campaign and promotional planning only works when the supply side knows what is coming. A promotion that sells out on day two is a forecasting failure, not a marketing success.
- Financial planning. Forecasted demand flows directly into revenue projections, operating cost models and cash flow planning.
The Supply Chain Impact
In interconnected global markets, supply chains are expected to be lean, responsive and cost-efficient at the same time. Demand forecasting is what makes that combination possible rather than contradictory.
- Smarter inventory positions. Rather than carrying blanket safety stock to suppress backorders, teams can tune stock by SKU and location against real demand signals, which improves turns and reduces obsolescence.
- Lower carrying costs. Excess inventory consumes working capital and adds storage, insurance and depreciation expense. Forecast-driven planning aligns stock with actual demand instead of worst-case assumptions.
- Stronger supplier collaboration. Sharing forward demand visibility with suppliers moves conversations earlier, which improves pricing, terms and delivery reliability. It also removes most last-minute procurement scrambles.
- Better service levels. Availability is what customers actually experience. Forecasting for demand surges and seasonal peaks is what protects fill rates when it matters.
Traditional Demand Forecasting Models And Where They Break Down
Before machine learning, demand forecasting ran on statistical methods. They are logical, transparent and still widely used. They are also structurally limited.
Moving averages smooth fluctuations by averaging demand across a fixed period. Simple and effective for stable demand; poor with seasonality or sudden shifts.
Linear regression establishes a relationship between demand and time or another variable. Useful where a clear linear trend exists; unreliable with non-linear or dynamic patterns.
Time series models (AR, ARIMA) account for trend, seasonality and noise. More sophisticated, and still a solid choice for short-horizon forecasting on products with long, clean histories.
Exponential smoothing weights recent observations more heavily than older ones. Better at short-term adjustment, but still built on the assumption that the future follows the past.
The Five Limitations That Matter
Traditional demand forecasting models share a set of constraints that become expensive in volatile markets:
- They assume historical continuity. These models extrapolate past patterns forward. When demand is disrupted by changing customer behavior, supply shocks, tariffs or a pandemic, the core assumption fails exactly when the forecast matters most.
- They cannot absorb external data. Economic indicators, competitor activity, promotional calendars and weather all move demand materially, and none of them fit neatly into a univariate time series model.
- They are manual and time-intensive. Data preparation, parameter tuning and model selection require statistical expertise and repeated human effort, which slows decisions and introduces error.
- They cannot adapt in real time. Refresh cycles are weekly or monthly. Early signals of a shifting trend get picked up after the inventory decision has already been made.
- They do not scale. Every additional product, channel and region multiplies the number of forecasts to maintain. At a few thousand SKU-location combinations, manual model management stops being viable.
AI vs Traditional Demand Forecasting: A Side-By-Side Comparison
| Dimension | Traditional Statistical Forecasting | AI Demand Forecasting |
| Data inputs | Historical sales only, usually one series at a time | Sales, inventory, pricing, promotions, weather, macro indicators, customer and channel data together |
| Granularity | Category or product family, monthly | SKU–location–channel, daily or weekly |
| Update frequency | Weekly or monthly batch cycles | Continuous, retrained as new data lands |
| New products | Requires a manual analog or judgment override | Learns from attribute-similar products and comparable launches |
| Promotions and price changes | Handled as manual adjustments outside the model | Modeled directly, including uplift and cannibalization effects |
| External signals | Not supported | Ingested as standard features |
| Response to disruption | Detected after the fact, corrected manually | Anomalies flagged early, forecast adjusts automatically |
| Planner effort | High — data prep, tuning, override management | Low — planners review exceptions rather than build forecasts |
| Scalability | Degrades sharply with SKU and location count | Scales to hundreds of thousands of series |
| Typical error reduction | Baseline | 20–50% error reduction reported by McKinsey in supply chain applications |
McKinsey’s research on AI operations forecasting found that applying AI-driven forecasting to supply chain management can reduce errors by 20 to 50 percent, translating into a reduction in lost sales and product unavailability of up to 65 percent, with warehousing costs falling 5 to 10 percent and administration costs 25 to 40 percent.
How AI Demand Forecasting Works
Artificial intelligence changes forecasting from a periodic statistical exercise into a continuous learning system. Rather than depending on a single model fitted to a single history, AI demand forecasting evaluates many data sources at once and selects the approach that performs best for each demand pattern.
The Model Families Behind It
“AI forecasting” is not one algorithm. Production systems typically combine several:
- Automated statistical models such as Auto-ARIMA and Prophet, which handle trend and seasonality well and remain strong baselines for stable, long-history items.
- Gradient boosting models (XGBoost, LightGBM), which excel at incorporating dozens of external features such as price, promotion flags, holidays and weather into a single forecast.
- Neural network models including LSTM and transformer-based architectures, which capture long-range dependencies and complex non-linear patterns across large SKU sets.
- Ensembles, which run multiple models in competition and weight their outputs by recent performance rather than committing to one method.
The practical advantage is model selection at scale: the system tests approaches per series and picks the winner, instead of a planner choosing one model for the entire catalog.
What That Produces
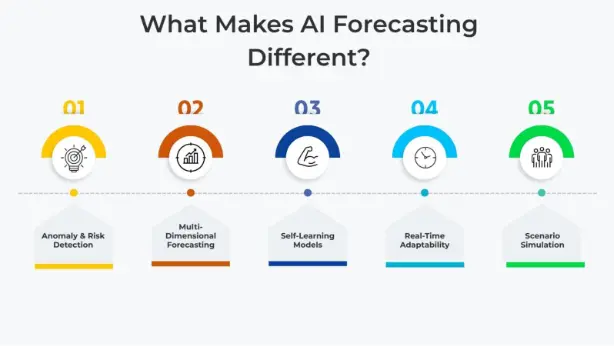
Self-correcting forecasts. The system learns from its own error. Each cycle of actuals feeds back into the next forecast, so accuracy compounds rather than decaying between manual retunes.
Multi-dimensional granularity. Forecasts are generated by SKU, location, channel and customer segment rather than by product line alone, because the compute cost of a hundred thousand forecasts is no longer the constraint it once was.
Real-time adaptability. When demand moves, the forecast moves. Disruptions and spikes are reflected in days rather than in the next planning cycle.
Anomaly and risk detection. Unusual demand patterns get flagged early, whether the cause is a supply issue, a viral trend or a quiet decline in a key account.
Scenario simulation. Modern platforms support what-if analysis. Teams can model the impact of a promotion, a supplier delay or a price change against historical patterns and external inputs, so plans can be tested before they are committed.
How Forecast Accuracy Is Measured
Most failed forecasting projects are measurement failures first. If you cannot state your current accuracy as a number, you cannot prove an AI system improved it. Four metrics matter, defined here in line with the Institute of Business Forecasting:
MAPE (Mean Absolute Percentage Error) averages the absolute percentage error across forecasts, ignoring direction. It is the most widely quoted accuracy metric and the easiest to communicate. It also distorts badly on low-volume and intermittent-demand items, where a small absolute miss produces an enormous percentage.
WAPE / WMAPE (Weighted Mean Absolute Percentage Error) weights error by volume, so a 5% miss on your top SKU counts more than a 90% miss on a slow mover. For inventory and supply decisions, WAPE is usually the more honest number.
Forecast bias measures systematic direction: whether you consistently over-forecast or under-forecast. A forecast can have acceptable MAPE and still be badly biased, and bias is what quietly builds excess inventory or chronic stockouts over quarters.
FVA (Forecast Value Added) measures whether each step and participant in the forecasting process actually improves the forecast versus a naive baseline. It answers the uncomfortable question: are the manual overrides your team applies making the forecast better, or worse?
Measure all four before a pilot. A baseline captured after implementation is not a baseline.
AI Demand Forecasting By Industry
The mechanics are consistent; the demand signals and constraints are not.
Manufacturing
Manufacturers forecast to drive production scheduling, raw material procurement and capacity planning, where lead times are long and changeover costs are real. AI models help by forecasting at the component and finished-good level simultaneously, factoring in order book signals, customer forecasts and supplier lead-time variability. The payoff is fewer expedited raw material buys and less finished goods sitting against orders that shifted.
Distribution and wholesale
Distributors carry breadth: tens of thousands of SKUs across multiple warehouses, much of it slow-moving or intermittent. This is where traditional models fail most visibly, because a moving average on an item that sells eleven units a year produces noise. AI approaches handle intermittent demand and long-tail items far better, and forecast at the SKU–warehouse level so replenishment and transfer decisions get made against real regional demand rather than a national average.
Retail and e-commerce
Retail demand is promotion-driven, seasonal and increasingly omnichannel. AI models quantify promotional uplift and cannibalization, meaning what a discount on one SKU does to the units beside it on the shelf. They also incorporate weather, local events and online browsing signals. Getting that right requires store-level forecasts refreshed daily, not monthly national numbers.
Food and beverage
Short shelf life turns forecast error into physical waste rather than carrying cost. Forecasting must be daily, location-specific, and sensitive to weather, holidays and local events. AI models that ingest those external signals directly reduce both spoilage and out-of-stocks on the same shelf, which statistical models tuned to one or the other cannot.
Healthcare and life sciences
Demand is driven by patient volumes, seasonality of illness, regulatory change and procedure mix. Stockouts are a patient safety issue, not a service level miss, and expiry write-offs are expensive. AI forecasting supports resource allocation, medication and consumable planning, and capacity forecasting against non-negotiable availability requirements.
How To Implement AI Demand Forecasting In 7 Steps
Step 1: Measure your current forecast accuracy
Before selecting any vendor, calculate MAPE, WAPE and bias on the last 12 months of your existing forecast, segmented by product velocity. Most organizations discover they have never measured this. Without it, every accuracy claim afterward is unfalsifiable.
Step 2: Audit and consolidate your demand data
Pull at least 24 months of sales history where it exists, plus inventory positions, price and promotion history, and customer or channel dimensions. Correct historical sales for stockouts. A period when you sold zero because you had zero is not zero demand, and training on uncorrected sales teaches the model to under-forecast the exact items you keep running out of.
Step 3: Scope one use case and one segment
Do not start with the whole catalog. Pick one business problem, such as replenishment forecasting for a single category or production planning for one plant, and one segment where the data is cleanest. A narrow pilot that proves value in eight weeks beats an enterprise rollout that stalls in month seven.
Step 4: Let models compete rather than choosing one
The right architecture tests multiple model families per demand pattern and selects on out-of-sample performance. Ask any vendor how model selection happens, and whether it is automated per series or configured once by a consultant.
Step 5: Backtest against your baseline
Run the new forecast on held-out historical data and compare it to what your current process actually produced over the same period. The bar is beating your baseline by a margin that justifies the cost, not achieving some abstract accuracy target.
Step 6: Put the forecast into a decision workflow
An accurate forecast in a dashboard nobody opens changes nothing. Connect it to the decisions it should drive: reorder points, purchase order recommendations, production schedules, safety stock parameters. Value is realized at the decision, not at the prediction.
Step 7: Set governance, monitoring and a retraining cadence
Define who owns forecast accuracy, how often models retrain, what triggers a manual review, and how overrides are tracked. Use FVA to check whether overrides are helping. Models drift; unmonitored ones degrade quietly.
What AI Demand Forecasting Costs And How ROI Is Calculated
Almost nobody publishes this, which makes it the hardest part of building a business case.
What You Actually Pay For
- Platform subscription, usually priced on some combination of users, SKU-location count, data volume and modules deployed.
- Data integration, connecting ERP, WMS, CRM and external sources. This is typically the largest one-time cost, and the one most often underestimated.
- Implementation and configuration, including model setup, historical data preparation and workflow design.
- Internal time, the line item that never appears in the proposal: your planners, data team and IT staff, for the duration of implementation.
- Ongoing ownership, covering monitoring, retraining oversight and periodic re-scoping as the business changes.
Cost scales primarily with integration complexity and the number of source systems — not with SKU count, which is where most buyers expect it to scale.
The Three Sources Of Return
- Inventory carrying cost. Better accuracy allows lower safety stock at the same service level. Multiply the inventory reduction by your carrying cost rate, typically 18% to 25% annually once capital, storage, insurance, shrink and obsolescence are included.
- Recovered lost sales. Every stockout is margin that walked. McKinsey’s finding of up to a 65% reduction in lost sales and product unavailability gives a defensible upper anchor. Model your own case at a fraction of it and it still usually clears the cost.
- Planner productivity. Time currently spent assembling spreadsheets converts to exception management and scenario analysis. This is real but the smallest of the three, so do not build the business case on it alone.
Building The Case
Take your current inventory value, your measured baseline error, and your documented stockout incidents from the last four quarters. Model a conservative improvement — the low end of McKinsey’s 20–50% error reduction range — and calculate the inventory and lost-sales impact against total cost of ownership over three years. If the case only works at the optimistic end of the range, it is not a case.
What To Look For In AI Demand Forecasting Software
Beyond model quality, these are the evaluation criteria that separate platforms that get used from platforms that get shelved. A fuller breakdown is in our guide to choosing AI demand forecasting software.
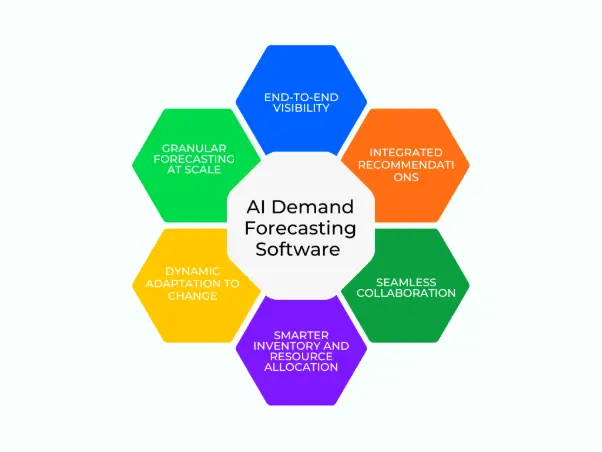
End-to-end data integration. The platform should aggregate ERP, CRM, WMS and third-party data — weather, economic indicators, channel signals — into one demand view. Siloed inputs produce siloed forecasts.
Granularity that matches your replenishment cycle. If you reorder weekly by warehouse, a monthly national forecast cannot drive that decision. Forecast granularity has to match decision granularity.
Automated model selection. Ask whether forecasting models are chosen per series automatically and re-evaluated over time, or configured once during implementation.
Prescriptive recommendations. A forecast that stops at a number leaves the hard part to the planner. Look for reorder timing, quantity and prioritization recommendations attached to the prediction.
Scenario planning. The ability to model supplier delays, promotional changes and demand shifts before committing to a plan.
Explainability. Driver-level attribution for why a forecast moved. Without it, adoption stalls.
Time to value. Pre-built templates for your industry and ERP shorten deployment from months to weeks. Ask for a reference customer with a comparable stack.
How ConverSight Approaches AI Demand Forecasting
ConverSight is built for mid-market supply chain and distribution teams who need forecasting that connects to the ERP they already run and produces decisions rather than dashboards. Three things define the approach.
Automated model selection across statistical and deep learning approaches
The platform runs Auto-ARIMA, Prophet and deep learning models in competition per demand pattern, selecting on out-of-sample performance and retraining as new data arrives. In [CUSTOMER NAME]’s deployment, forecast accuracy improved by more than 40% against a baseline MAPE of [X]% measured over [TIME PERIOD]. [Note to editor: this claim needs a named customer, the baseline figure and the measurement window before publishing. An unsourced accuracy percentage is the single weakest element on the current page.]
Conversational access through Athena
Athena, ConverSight’s AI Employee, lets planners, executives and sales teams query forecasts in natural language — “what does demand look like for Product A in Q4?” — and get a visualized answer with context, without writing queries or waiting on an analyst. The practical effect is that forecasts get used by people outside the planning team.
Where To Start
The first move is not selecting a vendor. It is measuring what your current forecast actually delivers — MAPE, WAPE and bias, segmented by product velocity, across the last twelve months. Most teams have never calculated it, and without that number every subsequent claim about improvement is unverifiable.
Do that, correct your sales history for stockouts, then scope a single category or site as a pilot. That sequence turns AI demand forecasting from a technology decision into a measurable business case.
Book a demo to see how ConverSight forecasts against your data.
Frequently Asked Questions
What is AI demand forecasting?
AI demand forecasting uses machine learning to predict future demand by learning patterns across historical sales, inventory, pricing, promotional and external data. Unlike traditional statistical models, it incorporates many variables simultaneously, forecasts at SKU and location level, and retrains continuously as new data arrives rather than assuming the future repeats the past.
How is AI demand forecasting different from traditional demand forecasting?
Traditional models extrapolate historical sales patterns forward using methods like moving averages and ARIMA. AI models learn non-linear relationships across dozens of internal and external variables, forecast at far finer granularity, adapt in near real time, and select the best-performing model per demand pattern automatically instead of applying one method across the catalog.
How accurate is AI demand forecasting?
Accuracy depends on data quality and demand volatility, so no universal figure applies. McKinsey research found AI-driven forecasting can reduce supply chain forecasting errors by 20 to 50 percent versus prior methods. The meaningful comparison is always against your own measured baseline, expressed in MAPE, WAPE and bias — not against a vendor benchmark.
How much historical data do you need to start?
Roughly 24 months of sales history is a practical starting point, since it allows the model to observe seasonality across two full cycles. Twelve months can work for fast-moving, low-seasonality products. Data quality matters more than volume — clean 18-month history outperforms five years of inconsistent, gap-filled records.
How long does it take to implement AI demand forecasting?
A scoped pilot on one category or site typically runs eight to twelve weeks, most of which is data integration and preparation rather than modeling. Full deployment across a catalog usually takes three to six months. Platforms with pre-built ERP connectors and industry templates compress the first phase significantly.
What does AI demand forecasting cost?
Cost has four components: platform subscription, data integration, implementation, and internal team time. Integration complexity and the number of source systems drive price far more than SKU count. Build the business case on reduced inventory carrying cost and recovered lost sales, then compare against three-year total cost of ownership.
Will AI replace demand planners?
No. It changes what planners do. Time spent assembling spreadsheets and tuning models shifts to exception management, scenario analysis, and judgment on new products and structural changes the model cannot see. Organizations that treat it as headcount reduction typically lose the domain knowledge that makes the forecast usable.
Which industries benefit most from AI demand forecasting?
Impact is highest where demand is volatile, SKU counts are large, or the cost of error is asymmetric — manufacturing, distribution and wholesale, retail and e-commerce, food and beverage, and healthcare. Food and beverage sees fast returns because forecast error becomes spoilage; distribution benefits because intermittent long-tail demand defeats statistical models.
Can AI demand forecasting work with our ERP?
Yes, and ERP data is normally the primary input. What varies is integration effort. Platforms with pre-built connectors for common systems deploy considerably faster than those requiring custom integration. Validate the connector against your actual transactional data during evaluation rather than accepting a compatibility list.
How do you measure whether an AI forecasting project worked?
Compare post-implementation MAPE, WAPE and bias against the pre-implementation baseline on the same product segments, then translate the accuracy gain into inventory reduction, service level improvement and avoided stockouts. Use Forecast Value Added to confirm each step in the process — including manual overrides — is improving the forecast rather than degrading it