How agentic demand planning moves your supply chain from monthly guesswork to decisions that execute.
The plan was perfect. Until it wasn’t.
Your quarterly forecast was locked and aligned. By week three, a supplier disruption hit, a competitor ran an unplanned promo, and a retail channel shifted allocation without notice. The plan was obsolete before anyone touched the model. This is not a forecasting failure. It is a decision latency problem. The average enterprise demand plan is wrong by 20–40% within two weeks of release not because the analysts are bad, but because human throughput cannot reconcile signals at the speed markets move. Most supply chain organizations today have more data than ever before ERP transactions, POS feeds, supplier signals, weather data, macroeconomic indices. The data is there. The decisions are not keeping up with it.
AI demand planning was built to close that gap. Not just better forecasts but faster, more confident decisions, made continuously, not once a month.
This guide breaks down how it works, what it actually replaces, and what it looks like when it is running at full capability. It is written for demand planners, supply chain directors, and operations leaders in manufacturing, distribution, and retail who want the mechanics not the pitch.
What AI Demand Planning Actually Means in 2026
AI demand planning is the use of machine learning, probabilistic modeling, and autonomous agents to generate, monitor, and continuously revise demand forecasts, without waiting for a human to run the next planning cycle. It is not a smarter spreadsheet macro. It is a shift in who or what holds the planning decision between cycles.
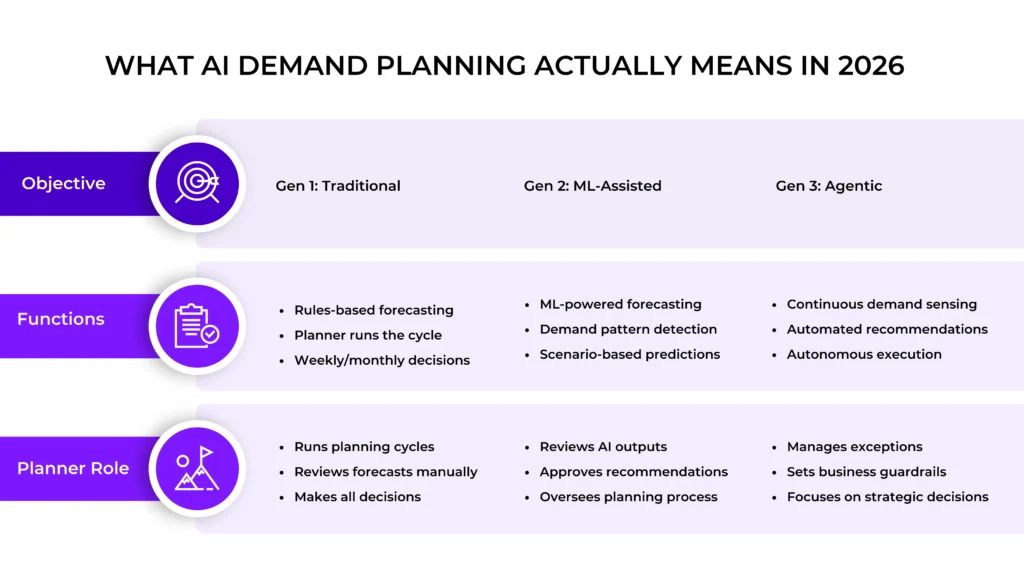
The technology has evolved through three distinct generations:
Gen 1 — Statistical / ERP Forecasting: Rules-based time-series models. The planner runs the cycle. Outputs are deterministic single numbers on a monthly or weekly cadence. Still the default for most mid-market ERP deployments.
Gen 2 — ML-Assisted Planning: Machine learning models produce forecast outputs. The planner reviews and decides. Accuracy improves, especially on volatile SKUs — but the process is still cycle-dependent and human-bottlenecked at the decision point.
Gen 3 — Agentic Planning: The AI monitors demand signals continuously, recommends adjustments with rationale, and executes within your ERP. The planner manages exceptions — not the cycle.
The distinction that matters in 2026 is not Gen 1 versus Gen 2. It is the gap between a forecasting tool and a demand planning agent. A forecasting tool gives you better numbers to look at. A demand planning agent closes the loop between signal and action, so the work gets done, not just informed.
The Real Cost of Getting Demand Wrong
Global excess inventory and stockouts cost businesses $1.1 trillion annually — IHL Group. The average manufacturer ties up 20–30% of working capital in inventory that should not be there. Stockouts cost retailers an estimated 4% of annual revenue in lost sales.
Those are the numbers most teams track. The costs they miss run deeper:
- Expedite freight: Last-minute air or premium logistics to recover from a late demand signal
- Planner hours: Time spent reconciling ERP outputs in Excel instead of making decisions
- Supplier relationship damage: Erratic purchase orders driven by bad demand signals erode lead time reliability over months
- Missed promotional lift: The model never saw the event signal, so replenishment was never pre-positioned
- Markdown erosion: Overforecast inventory that exits at discount margin
Post-pandemic, most supply chains de-buffered aggressively. Lean inventory, reduced safety stock, tighter supplier contracts. The buffer is gone. When the forecast is wrong in 2026, the customer feels it faster and the P&L feels it harder.
Gartner data shows organizations with mature AI demand planning capabilities reduce forecast error by 20–50% versus laggard peers. At scale, that difference pays for the platform, the implementation, and the organizational change within the first year.
How AI Demand Planning Works: Inside the Model
Signal ingestion
AI demand planning starts with a broader signal set than any traditional model. Internal signals include historical sales transactions, current order book, inventory positions, promotional calendars, and product lifecycle stage. External signals include weather patterns, macroeconomic indices, social listening data, competitor pricing movements, and retail channel performance. Most ERP-based forecasting uses only internal historicals. AI demand planning uses all of it, which is the first reason forecast quality improves.
Model architecture
Modern AI demand planning platforms run ensemble models, multiple model types combined for robustness. Time-series models (ARIMA, Exponential Smoothing) handle stable, seasonal patterns well. Machine learning models (gradient boosting, neural networks) are strong on pattern discovery and signal correlation across large datasets. Causal models are built to understand why demand changes, not just that it changed.
Continuous learning and anomaly detection
AI demand planning models update on every new data transaction not just at the next monthly cycle run. Forecast lag shrinks from weeks to hours. Anomaly detection flags demand pattern breaks in real time: velocity shifts on a top SKU, regional spikes, channel mix changes — surfaced as exceptions before the weekly report. When a planner overrides a recommendation, that context becomes model training data. The system learns from their expertise.
Probabilistic vs. Deterministic Forecasting: Which One Your Business Actually Needs
Deterministic forecasting produces a single number per SKU per planning period. “You will sell 400 units next month.” Based on historical averages and rules-based adjustments, it is still the default output of most ERP statistical forecasting modules. The problem: a single number has no risk signal. It tells you the most likely outcome, not the range of outcomes your inventory and procurement decisions need to account for.
Probabilistic forecasting produces a range with confidence levels. “70% confidence you will sell between 380 and 440 units. 15% probability you exceed 480.” It accounts for demand variability, seasonality, external signal uncertainty, and model confidence simultaneously — and gives planners a high-side and low-side scenario to work with when setting safety stock, procurement buffers, and capacity reservations.
The operational difference is significant. A deterministic plan set to 400 units with 20% actual variance means you are either short 80 units or carrying 80 excess, on every SKU, every cycle. A probabilistic plan with explicit safety stock buffers derived from the confidence interval absorbs that variability structurally, not reactively.
For new product launches, seasonal peaks, and promotional events, where uncertainty is highest — probabilistic demand planning is not optional. It is the only output that gives planners an actionable range to work with.
How to Detect (and Adjust for) Demand Sensing Signals from Weather, News, and Social
Demand sensing is the practice of using near-real-time external signals to detect demand shifts before they appear in your sales transaction history. Standard demand planning works backward from history. Demand sensing works forward from signals that precede purchasing behavior. By the time a demand spike shows up in your order data, you are already behind on replenishment. Demand sensing catches the signal 7–14 days earlier.
Weather signals: Temperature deviation from seasonal norms correlates directly with demand in HVAC, apparel, beverages, agriculture, and construction materials. Severe weather events create spikes in emergency supplies and shelf-stable food — detectable 5–10 days in advance through forecast feeds. The AI ingests weather API data continuously, correlates it against historical weather-demand patterns by SKU and region, and adjusts short-term forecasts before the signal appears in orders.
News and event signals: Port strikes, geopolitical disruptions, and commodity price movements affect procurement behavior. Local events sporting fixtures, public holidays, regional promotions create predictable demand lifts in proximity retail. Natural language processing on news feeds flags events relevant to your product categories and geography, triggering forecast adjustments within defined thresholds.
Social and sentiment signals: Social listening tracks product mentions, brand sentiment shifts, and competitor activity that precede changes in consumer purchasing behavior. Viral moments and influencer-driven demand spikes are detectable in social signal data 3–7 days before they hit order volumes early enough to act on replenishment if your platform is watching.
Most planning teams ignore these signals because their ERP-native tools cannot ingest them and planners lack the bandwidth to monitor them manually. The cost: promotional stockouts, weather-driven excess inventory, and demand spikes that better-equipped competitors captured first.
What Agentic Demand Planning Looks Like When It’s Actually Running
Monday morning. No war room.
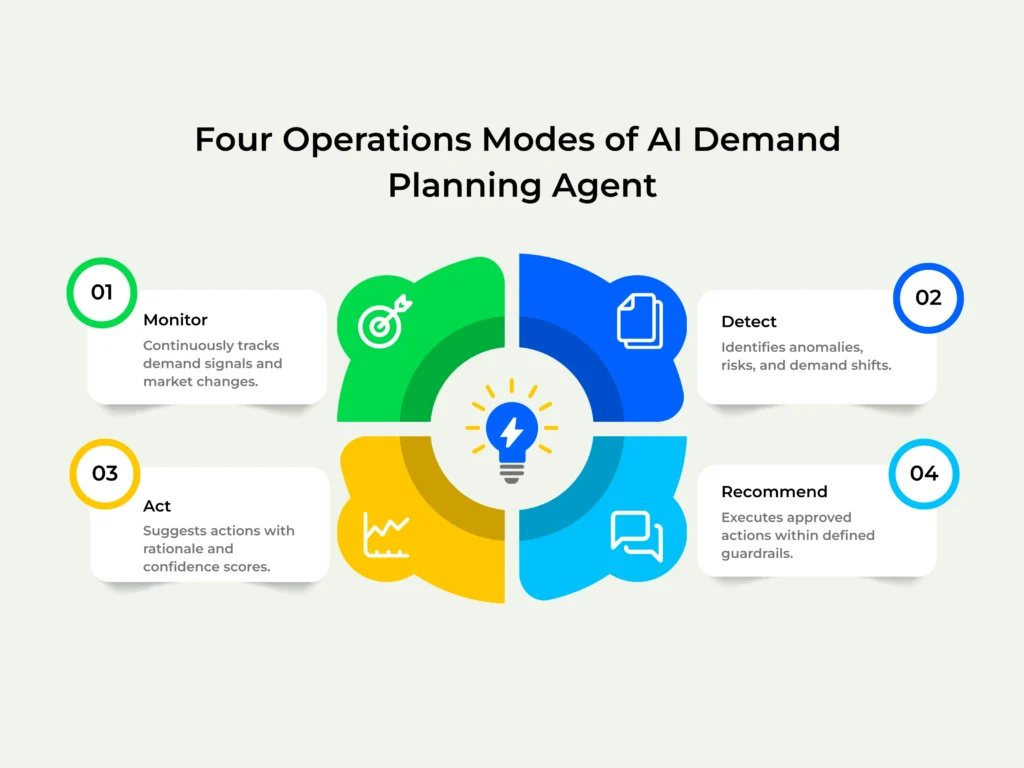
The agent scanned weekend POS data overnight. It flagged three SKUs with velocity deviation above 15% versus the current forecast. For two of them, it updated the short-term forecast and staged replenishment recommendations in the ERP for planner review. The third it escalated — the deviation pattern is unusual enough that it wants human judgment before acting.
Your planner logs in at 8am. Their queue shows three flagged items, two pending approvals, and one escalation. The rest of the demand picture has already been managed.
The promotional lift scenario: A retail partner announces a flash promotion for next week. The agent detects the event through the promotional calendar signal feed. It models expected lift by SKU and region, cross-references current inventory positions and supplier lead times, and generates a replenishment pre-positioning recommendation — 10 days earlier than the standard planning cycle would have surfaced it. The planner approves. Stock arrives in time. The promotion hits without a stockout. This is not a dashboard insight. It is a decision that executed.
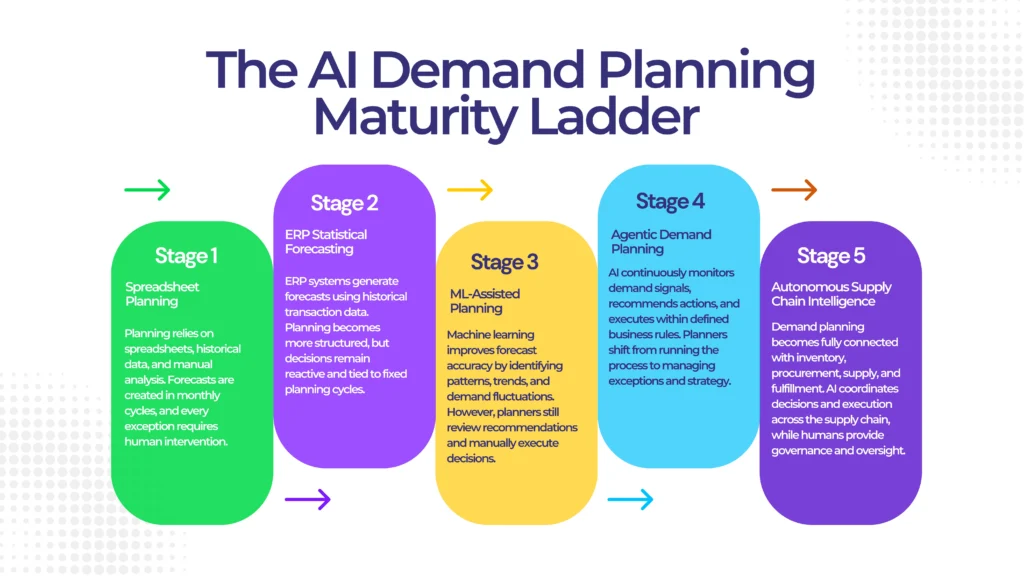
The AI Demand Planning Maturity Ladder
Stage 1 — Spreadsheet Planning: Excel-based, analyst-driven, monthly cycle, signal horizon is last quarter. Every exception is manual. The plan can only be as good as what one person can process.
Stage 2 — ERP Statistical Forecasting: System-generated forecasts using historical transaction data. Better throughput, but still deterministic, still cycle-based, still reactive. No external signal ingestion. Where most mid-market businesses sit today.
Stage 3 — ML-Assisted Planning: Machine learning models layered on. Better accuracy on volatile and seasonal SKUs — but still human-bottlenecked at the decision point. The AI generates. The planner decides. The ERP is updated manually.
Stage 4 — Agentic Demand Planning: AI agent continuously monitors, detects, recommends, and executes within authorization thresholds. Planner role shifts from model operator to exception manager and strategy owner. Accessible today for mid-market organizations in 6–12 months with the right platform.
Stage 5 — Autonomous Supply Chain Intelligence: Demand planning fully integrated with supply, inventory, procurement, and fulfillment. AI executes across the supply chain decision layer within governance thresholds. Human oversight at the policy and exception level. Where leading organizations are heading over the next 3–5 years.
Forecast Accuracy Isn’t Enough: The Real KPIs for AI Demand Planners
MAPE is the industry default and one of the most misleading single metrics in supply chain. It treats a 20% over-forecast and a 20% under-forecast as equivalent. They are not. One creates excess stock. The other creates a stockout. The business impact is entirely different. It also penalizes volatile, high-value SKUs disproportionately and does not connect to business outcomes your CFO can act on.
Here is the measurement framework that actually reflects planning quality:
- Forecast Bias: Are you consistently over- or under-forecasting? Systematic bias creates structural inventory problems that MAPE cannot see. Measure it as (sum of forecast − actual) / sum of actual, tracked over rolling 13-week and 52-week windows by SKU and category.
- Forecast Stability: How much does the forecast change between planning cycles for the same future period? High instability means procurement, production, and logistics cannot rely on the number from last week — so they build their own buffers and your plan loses authority.
- Value at Risk (VaR) by SKU: Multiply forecast error rate by average inventory value and holding cost. That is the dollar amount sitting at risk in your warehouse right now. This connects forecast accuracy KPIs directly to working capital — the conversation your CFO actually wants to have.
- Decision Cycle Time: How long from a demand signal change to a planning adjustment in the ERP? For most Stage 2–3 organizations, this is 5–15 days. For Stage 4 agentic organizations, this is hours. This is the metric AI demand planning moves most dramatically.
- Planner Productivity Ratio: What percentage of planning team time goes to low-value cycle work versus exception management and strategic scenario planning? AI demand planning shifts this ratio. Tracking it makes the human ROI reportable to leadership.
- S&OP Alignment Rate: How often does the consensus demand plan survive the S&OP process without significant revision? High alignment means the plan is trusted upstream. Frequent revision means the forecast quality problem needs to be fixed at the source not patched in the meeting.
How ConverSight Brings AI Demand Planning to Life
Most demand planning tools stop at the forecast. They produce a number, hand it back to the planner, and leave the gap between insight and action entirely on their shoulders.
Conversight’s Demand Planner Agent, is designed to close that gap. Athena works the way a skilled planning analyst would across every SKU, every cycle, without the bandwidth constraint. It surfaces a recommendation for each SKU, shows the reasoning behind it, and lets the planner adjust where their judgment adds value, a promotion, a new launch, a supplier constraint the model cannot see — before publishing a single version of the forecast the entire organization works from. The most common S&OP problem is not inaccurate data. It is three versions of the same forecast built in different spreadsheets by different people. Athena produces one version. One number. No reconciliation required.
Problem SKUs are flagged before they reach the plan. And when a planner overrides a recommendation, that context feeds back into the system — Athena learns from the people using it. The result: the cycle work gets done. The planner focuses on strategy.
See Conversight’s Demand Planner Agent in action! Click Here
From Data to Decision to Done
The demand planning problem has never been a data problem. The data has existed for years. The problem is decision latency, the gap between a signal arriving and a planning decision being made and executed. That gap costs money every day it exists. In 2026, with lean supply chains and tighter margins, it costs more than most organizations are tracking.
AI demand planning does not make forecasters irrelevant. It makes sure their expertise is applied to the decisions that require it, not consumed by cycle mechanics that a machine handles better.
The organizations winning in supply chain today are not the ones with the most data. They are the ones making better decisions faster with the data they already have. Stage 4 is not a future state. It is accessible today, for mid-market organizations, with the right platform.
From data to decision to done.
Experience AI demand planning in action – Request a ConverSight demo today!